ERASE Racism's new interactive, research report, "Empire State Inequities: A Decade of School Funding Disparity and Its Effects," is a longitudinal review of the impact of inequitable traditional public school funding in New York State. Specifically, the report finds that inequity in funding is compounded by racial segregation and disproportionate tax burdens. More importantly, this report finds that traditional public school funding and student performance are closely aligned. The findings provide an opportunity to dispel long-standing myths about the performance of students of color. We close the report by proposing actions that school districts and states can take to begin the process of addressing the impact of institutional, systemic, and structural racism as it pertains to school funding disparities.
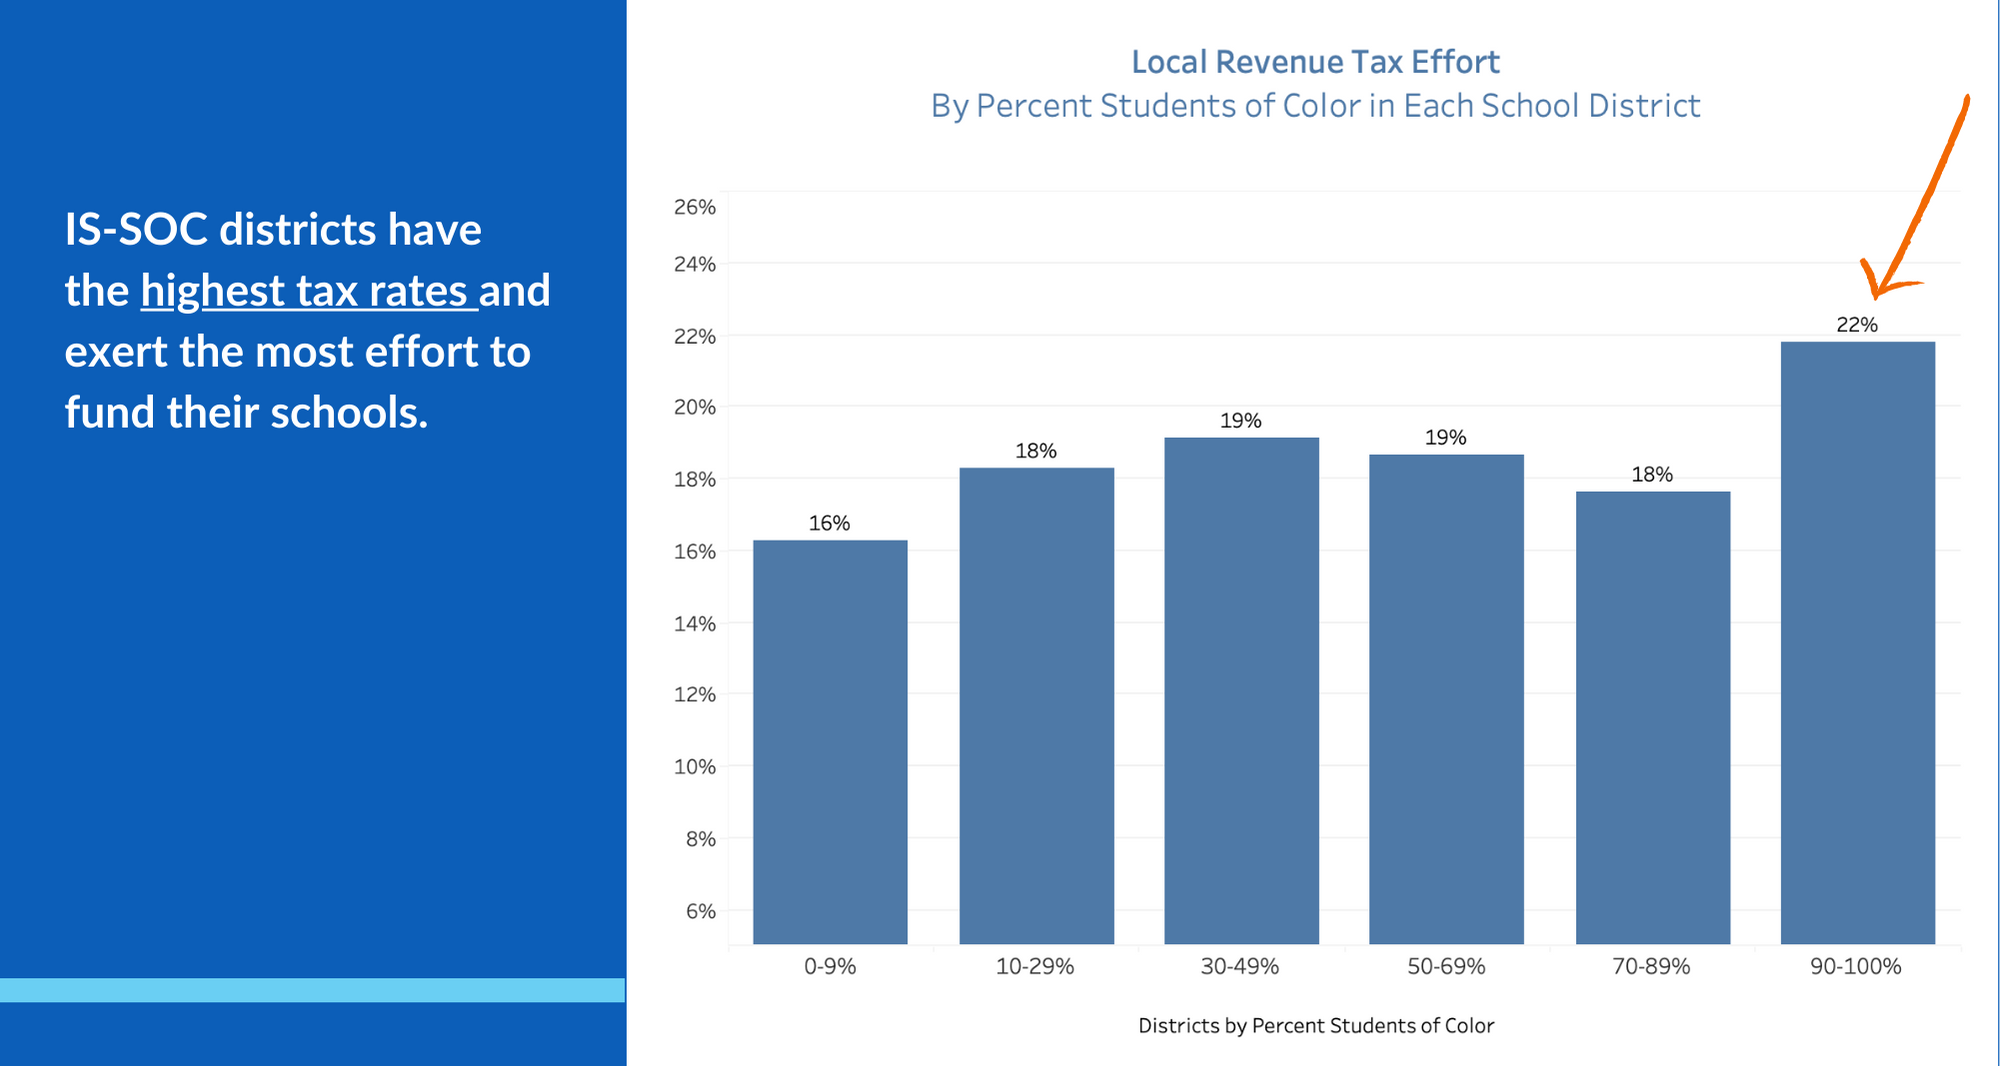
Using data averages from 2011, 2016, and 2021 (the latest fiscal data available), we find that in New York State's racially segregated school districts, specifically those composed of 90-100% students of color (referred to as Intensely Segregated Student Of Color districts- or IS-SOC), residents with the lowest taxable property and gross income bear the brunt of the highest tax rates. Crucially, the fact that these IS-SOC districts have the highest tax rates demonstrates the extraordinary effort these districts exert to fund their school districts. Furthermore, when differences in regional cost of living and student need are considered, we find that supplemental state and federal funding have done little to close the revenue gap for IS-SOC districts. In fact, this supplemental funding has most benefited districts that are 91-100% white.

Download a PDF version of the report here.
View the press release here.
Key Findings
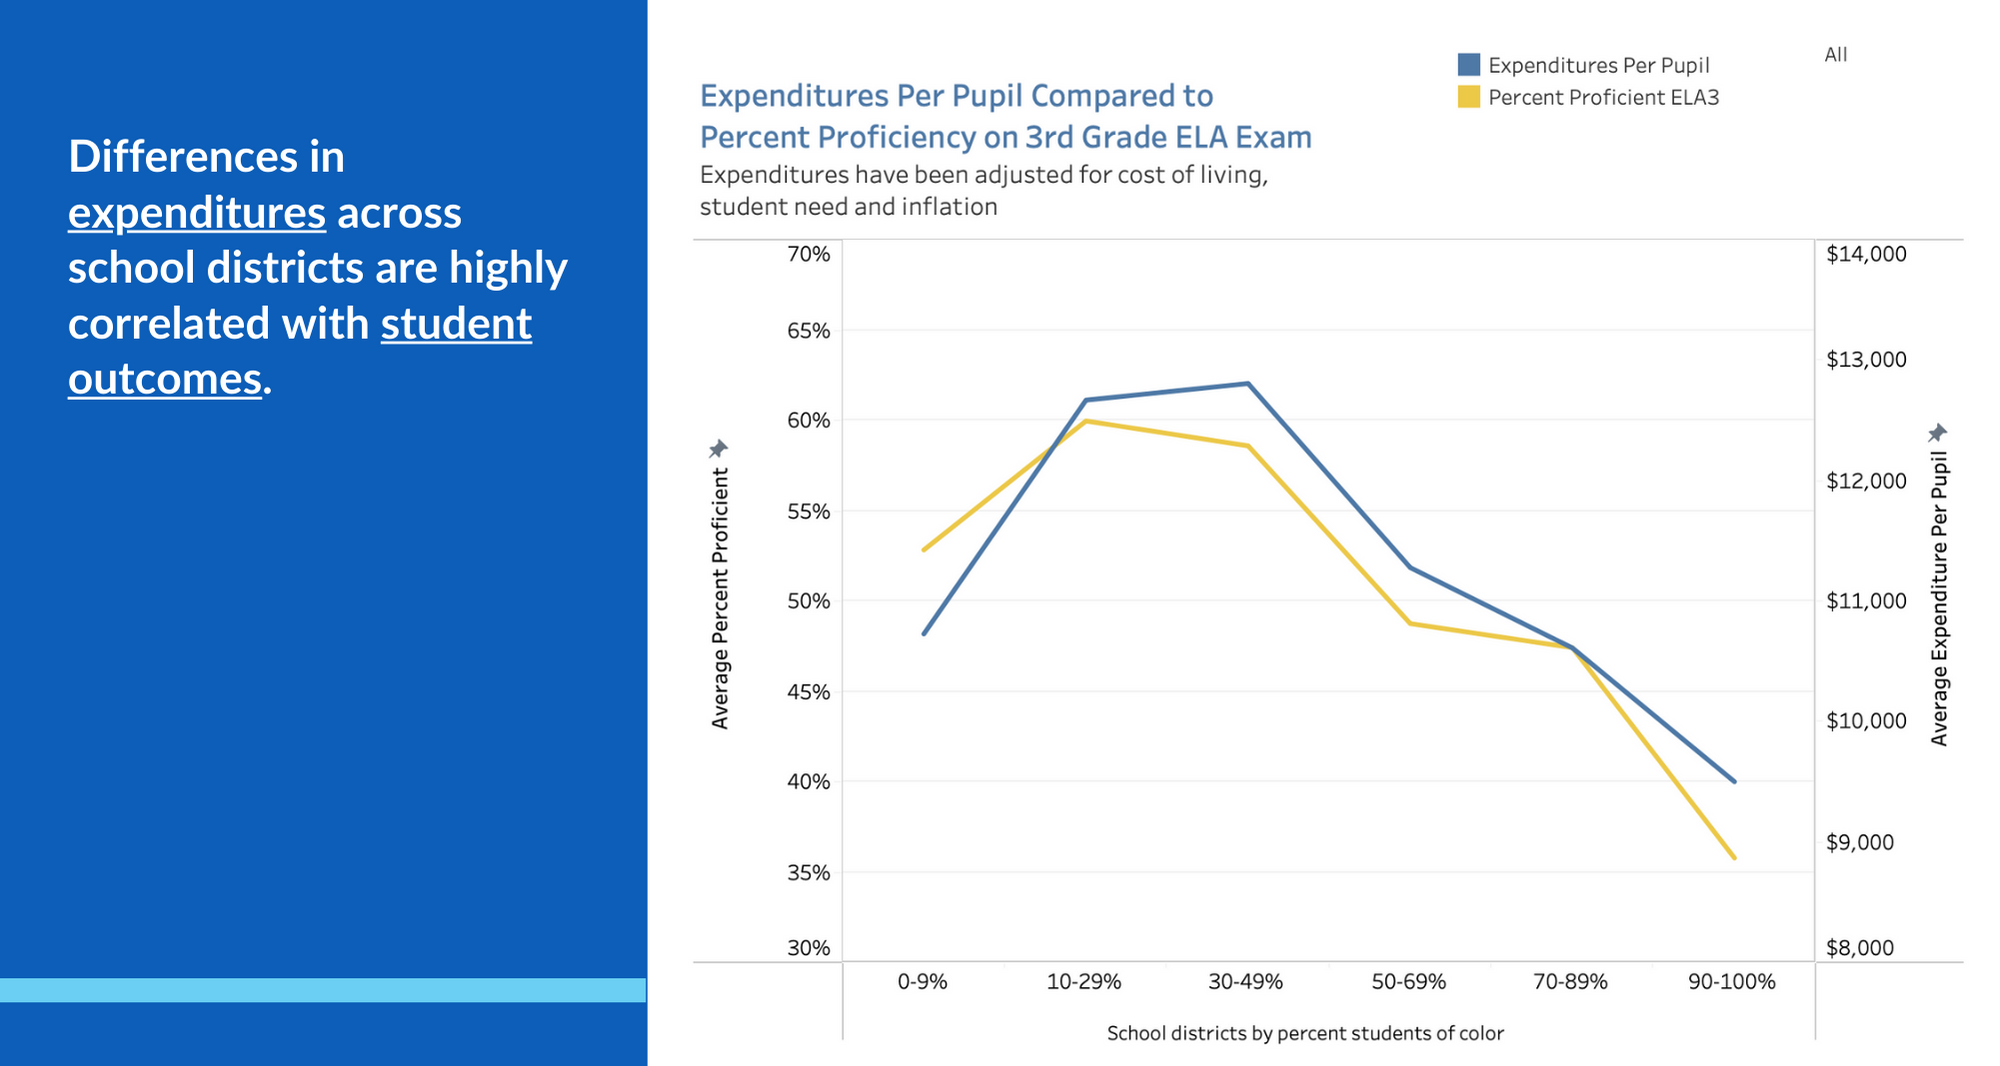
- Differences in expenditures across the state are highly correlated with student performance. When differences in regional cost of living and student need are taken into consideration, there is a direct correlation between per-pupil expenditures and the percentage of students who are proficient in 3rd-grade English.
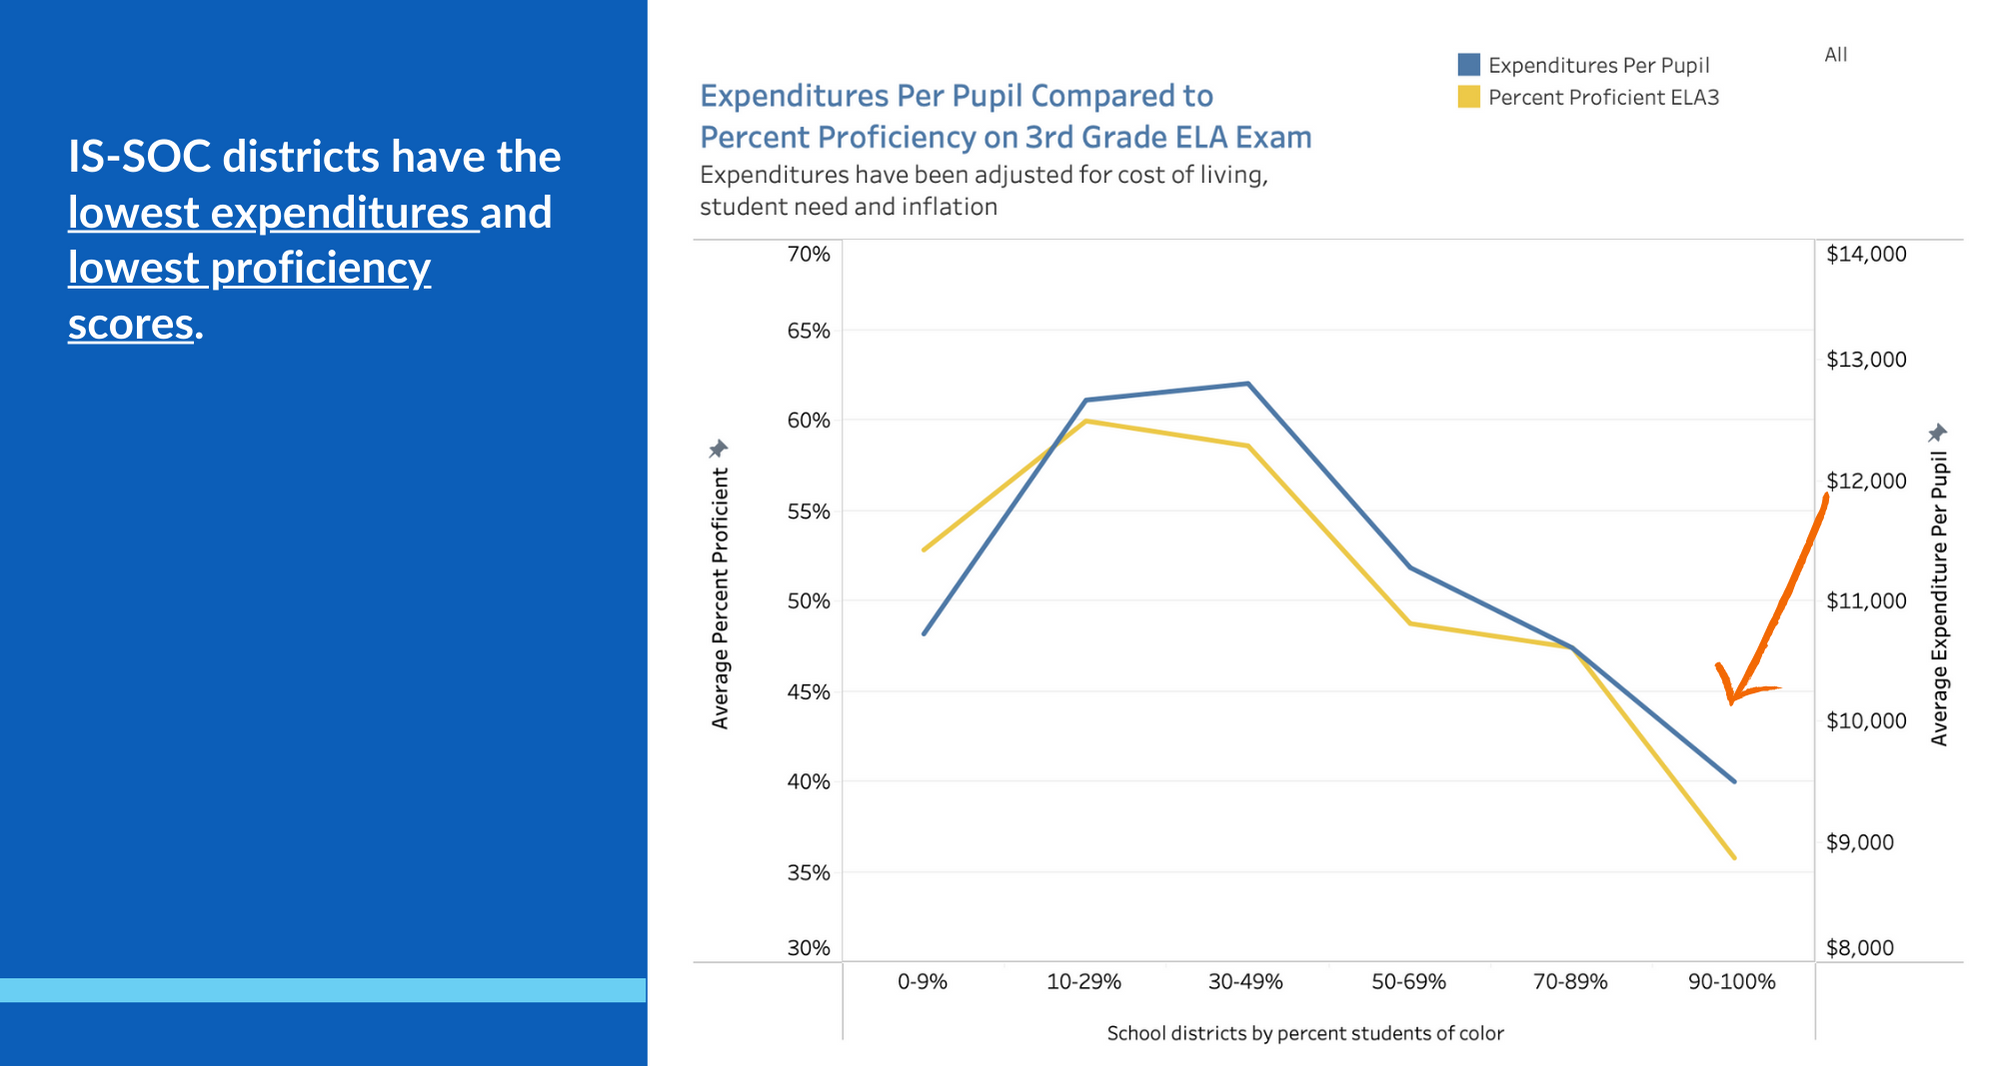
- School districts with the highest percentages of students of color (IS-SOC districts) have historically had the lowest per-pupil expenditures. Furthermore, throughout the past ten years, their average expenditures have been declining at a faster rate than other school districts.
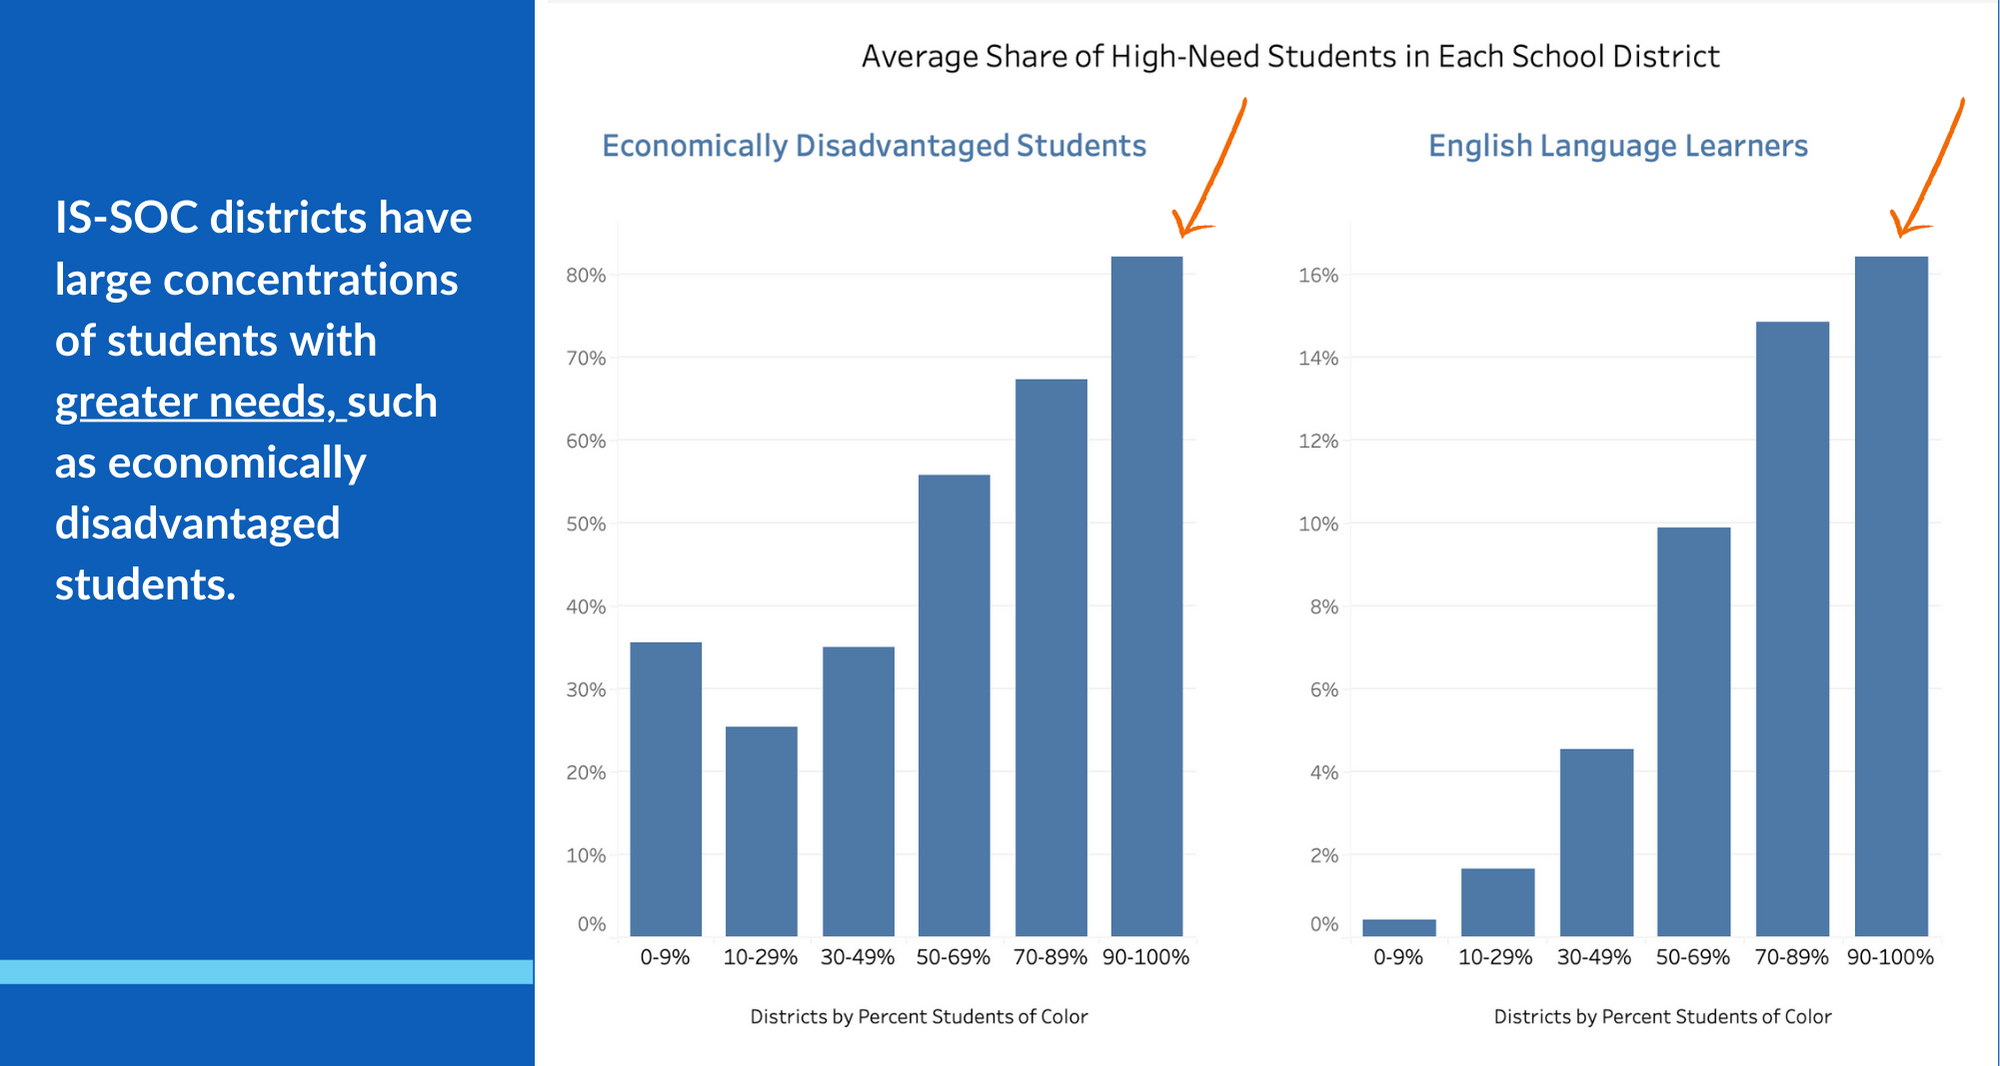
- Even though New York State is racially diverse, 1 out of 3 students of color attends a school district that is intensely segregated and lacks essential resources. These districts also have a disproportionate share of high-need students that require supplementary resources.
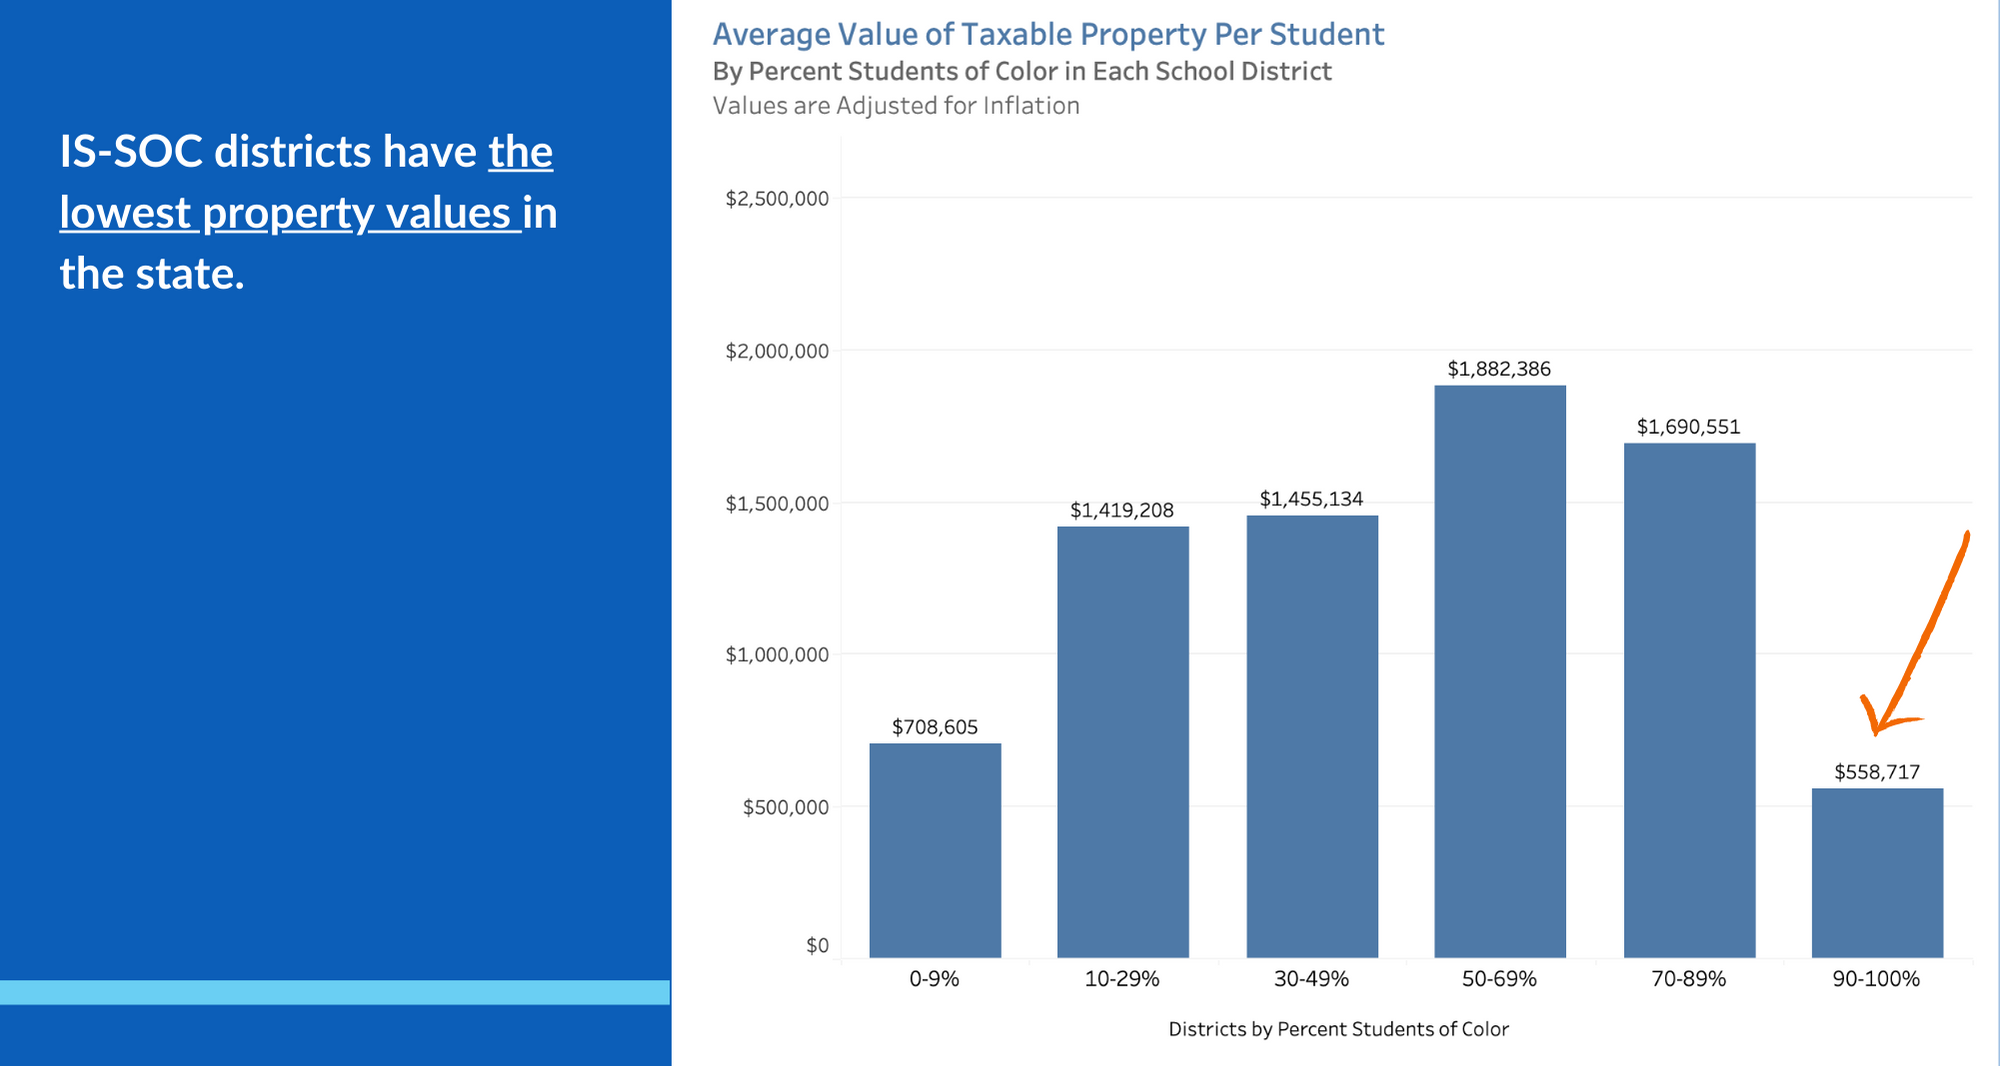
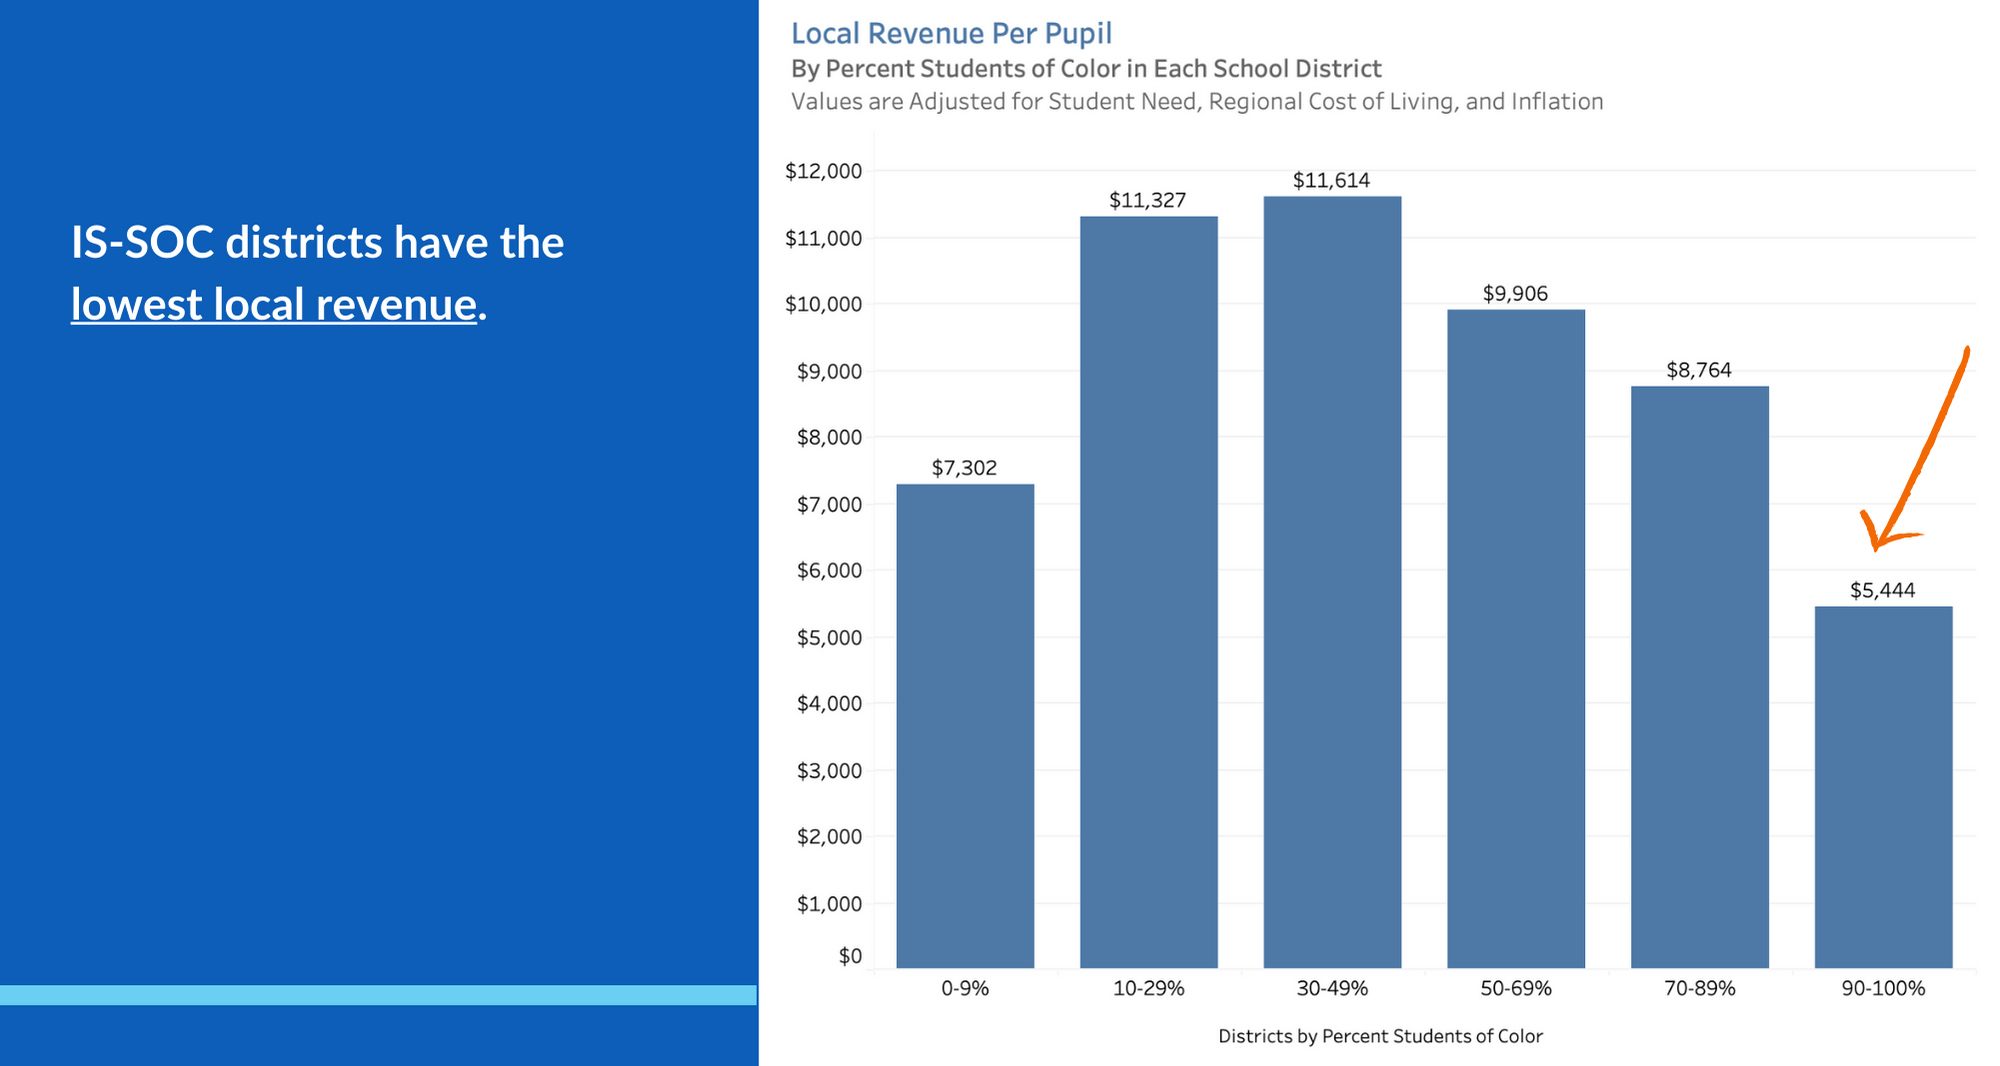
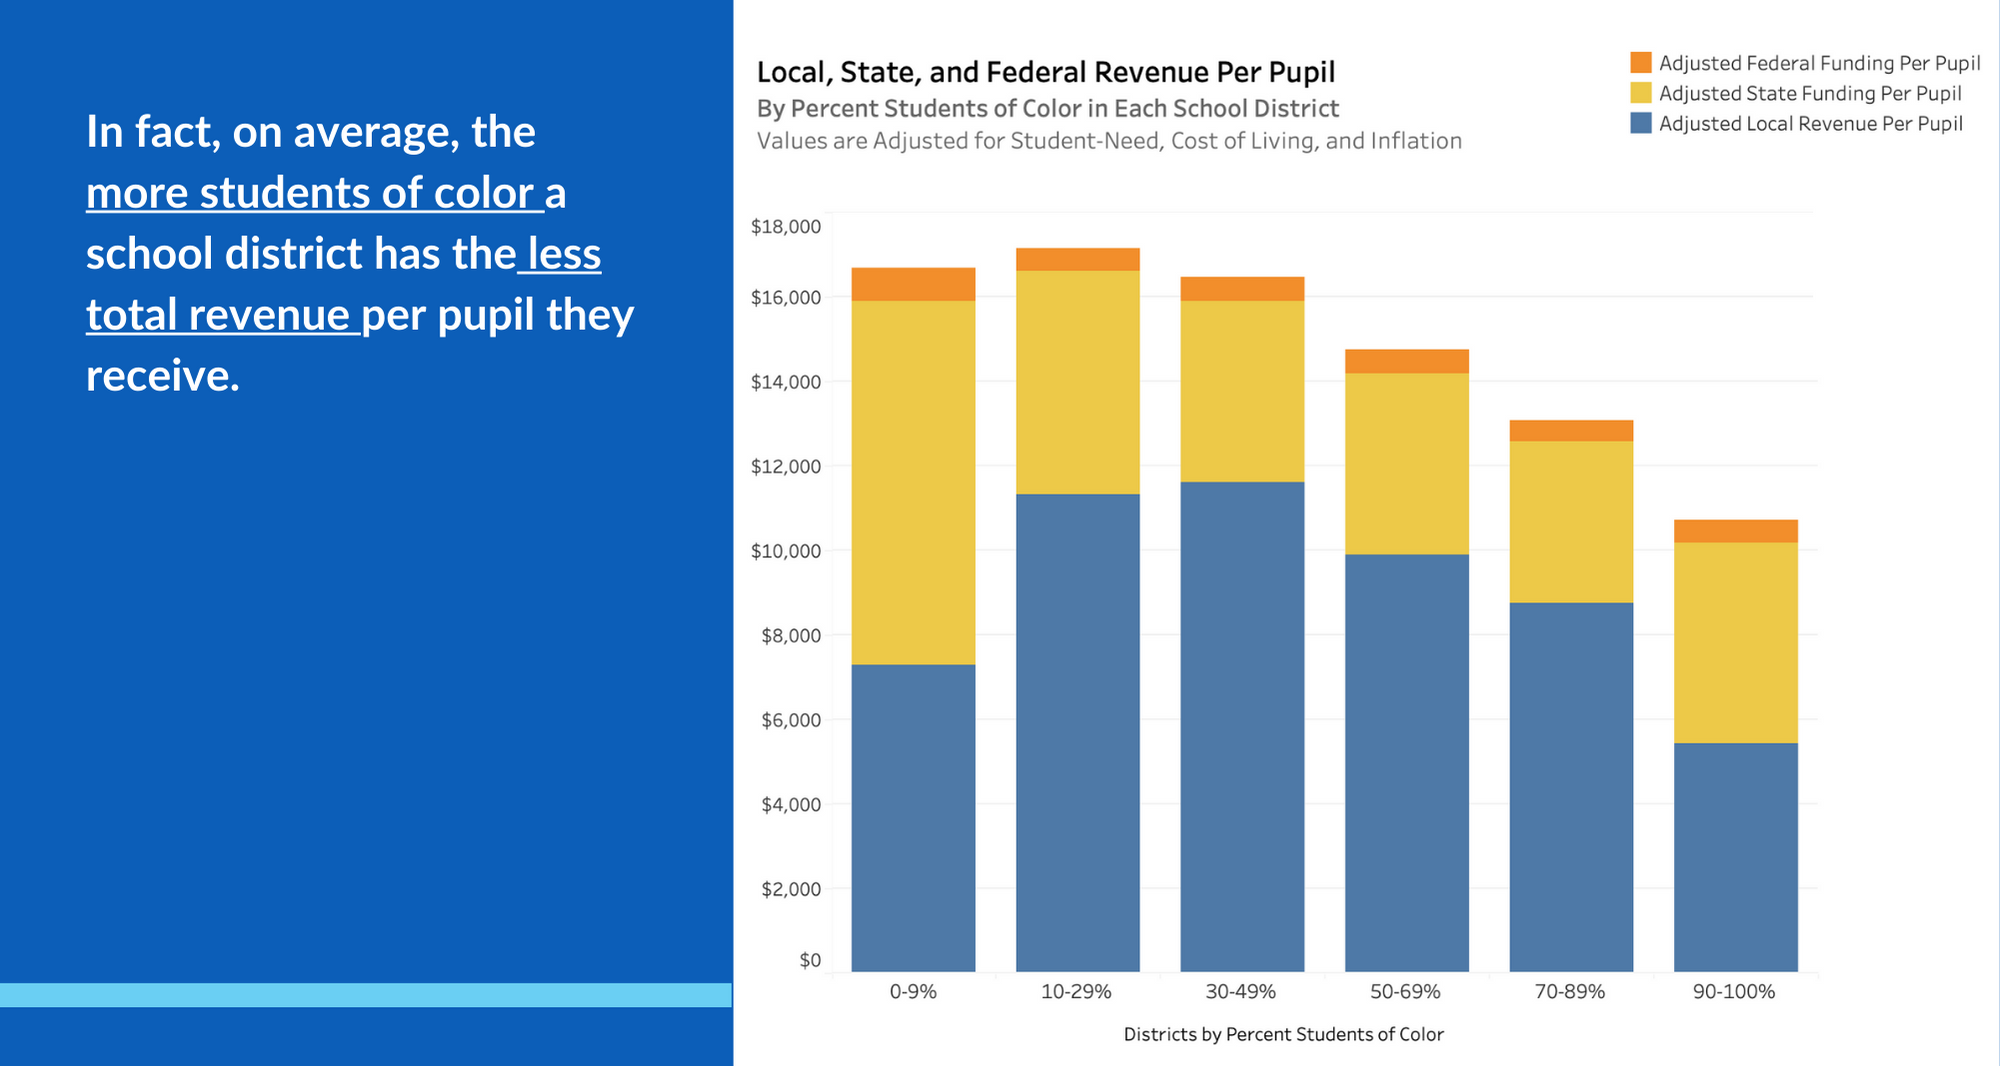
- New York's IS-SOC districts have the lowest taxable property values and the lowest local revenue; yet, they have the highest tax rates and tax burden.
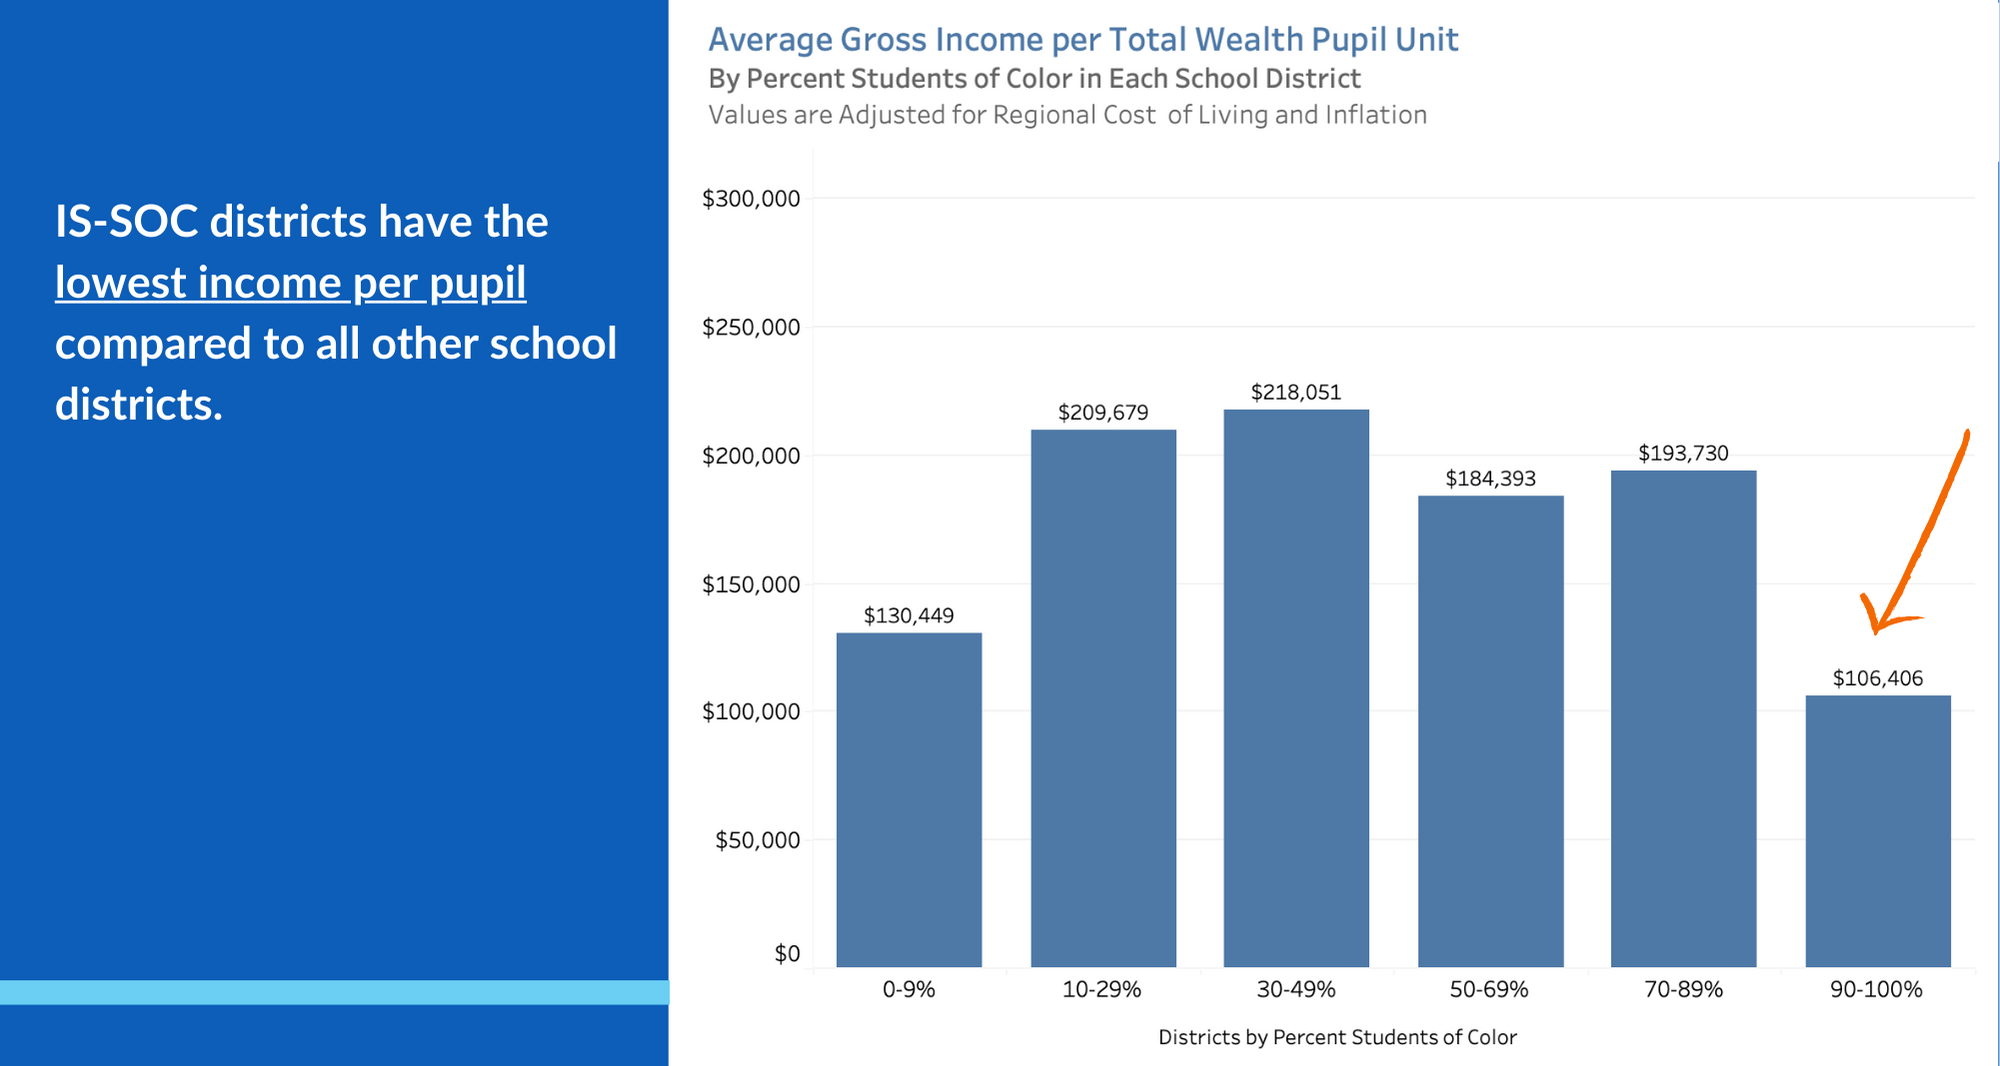
- IS-SOC districts are unable to rely on supplemental sources of funding, such as their personal income, since, on average, these districts have the lowest income per pupil.
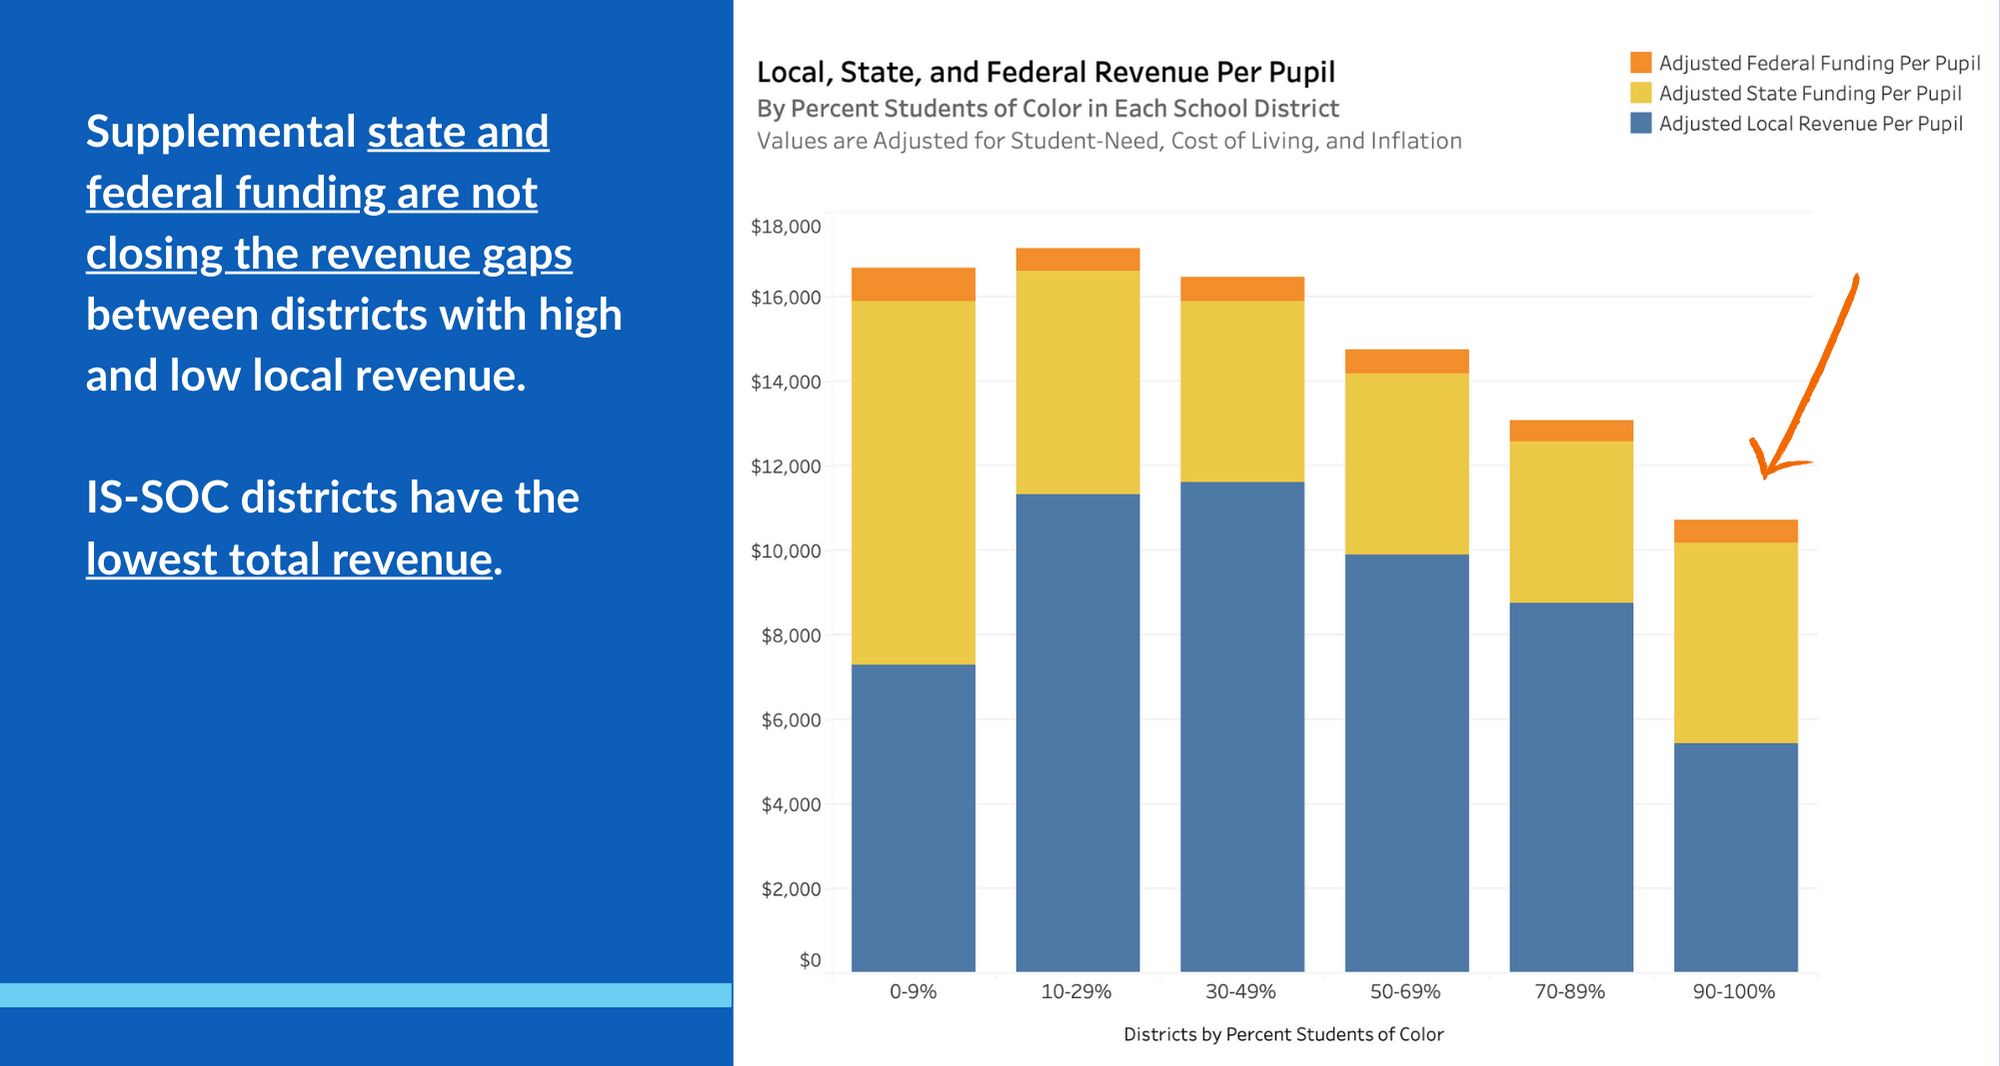
- Supplemental state funding has done little to alleviate the cost burden experienced by IS-SOC districts. When differences in regional cost of living and student need are considered, supplemental state and federal funding have disproportionately benefited districts that are 91-100% white while doing little to close the revenue gap for districts with the highest proportions of students of color and need.
How to Navigate This Report
This report – "Empire State Inequities: A Decade of School Funding Disparity and Its Effects" – tracks district-level racial disparities over a decade. Rather than making claims about funding inequities that are based on a single school year, the report's findings average values from 2011, 2016, and 2021 and are presented with interactive data visualizations to encourage readers to explore the data provided.
To navigate this report, click on the yellow slides in the top toolbar. Most pages will have text describing a key finding accompanied by a data visualization. Be sure to hover over the data visualization and change the year to view more information.